Monedas fiat
Criptomonedas
No hay resultados para ""
No pudimos encontrar nada que coincida con su búsqueda. Vuelva a intentarlo con un término diferente.
How to Read Crypto Candlestick Charts: A Beginner’s Guide
If you are interested in trading cryptocurrencies, you might have heard of crypto candlestick charts. These charts are a popular way of visualizing the price movements of different crypto assets over time. But what exactly are crypto candlestick charts, and how can you read them? In this article, we will explain the basics of crypto candlestick charts, how they differ from other types of charts, and how you can use them to analyze the crypto market.
What Are Crypto Candlestick Charts?
Crypto candlestick charts are a type of technical analysis tool that shows the opening, closing, highest, and lowest prices of a crypto asset for a given time period. Each time period is represented by a candlestick, which has a rectangular body and a thin line (or wick) on both ends. The body of the candlestick shows the difference between the opening and closing prices, while the wicks show the range of prices within the time period.
The color of the candlestick indicates whether the price went up or down during the time period. A green (or white) candlestick means that the closing price was higher than the opening price, indicating a bullish (or upward) movement. A red (or black) candlestick means that the closing price was lower than the opening price, indicating a bearish (or downward) movement.
Here is an example of a crypto candlestick chart for Bitcoin (BTC) in USD:

As you can see, the chart shows the price movements of Bitcoin over a 24-hour period, with each candlestick representing one hour. You can also see the volume bars at the bottom of the chart, which show how much Bitcoin was traded during each hour.
Why Use Crypto Candlestick Charts?
Crypto candlestick charts are widely used by traders and investors because they provide a lot of information in a simple and intuitive way. Compared to other types of charts, such as line charts or bar charts, crypto candlestick charts can help you:
- Identify the trend of the market. By looking at the overall direction and color of the candlesticks, you can see whether the market is in an uptrend, downtrend, or sideways movement.
- Spot patterns and signals. By analyzing the shape and size of the candlesticks, you can recognize certain patterns and signals that indicate potential price movements or reversals. For example, a long green candlestick followed by a short red candlestick might signal a bearish reversal, while a long red candlestick followed by a short green candlestick might signal a bullish reversal.
- Measure the strength and volatility of the market. By looking at the length and width of the candlesticks and their wicks, you can gauge how strong and volatile the market is. For example, a long and wide candlestick with short wicks means that the market was very active and decisive, while a short and narrow candlestick with long wicks means that the market was indecisive and uncertain.
How to Find Crypto Candlestick Charts?
There are many online platforms and tools that offer crypto candlestick charts for various crypto assets and time frames. The easy way for you to find candlestick charts is CoinCarp.com, CoinCarp has integrated the Tradingview Candlestick Charts. Click the "Candle Chart" button on the crypto detail page, you can switch the price chart to the Candlestick Chart.

How to read crypto candlestick charts?
Now that you know what crypto candlestick charts are and where to find them, let’s learn how to read them. Here are some basic steps to follow:
- Choose a crypto asset and a time frame. Depending on your trading style and goals, you can choose a crypto asset that suits your preferences and a time frame that matches your strategy. For example, if you are a day trader, you might want to look at a 15-minute or an hourly chart, while if you are a long-term investor, you might want to look at a daily or a weekly chart.
- Identify the trend of the market. The first thing you want to do is to determine whether the market is in an uptrend, downtrend, or sideways movement. You can do this by looking at the direction and color of the candlesticks, as well as using trend lines or moving averages. For example, if the candlesticks are mostly green and above the moving average, the market is in an uptrend, while if the candlesticks are mostly red and below the moving average, the market is in a downtrend.
- Spot patterns and signals. The next thing you want to do is to look for any patterns or signals that might indicate a possible price movement or reversal. There are many types of candlestick patterns and signals, such as doji, hammer, engulfing, morning star, evening star, and so on.
- Measure the strength and volatility of the market. The last thing you want to do is to assess how strong and volatile the market is. You can do this by looking at the length and width of the candlesticks and their wicks, as well as using indicators such as volume, RSI, or Bollinger Bands. For example, if you see a long and wide green candlestick with high volume, it means that the market was very bullish and that the buyers were in control, while if you see a short and narrow red candlestick with low volume, it means that the market was very bearish and that the sellers were in control.
Examples of Candlestick Patterns
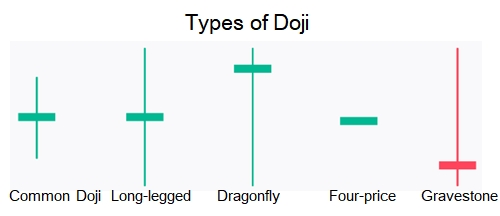
- Doji: A Doji is a candlestick with a very small or no body and long shadows on both ends. It shows that the opening and closing prices are almost equal, and that the market is very indecisive. A Doji can signal a reversal after a strong trend, or a continuation of a sideways movement.
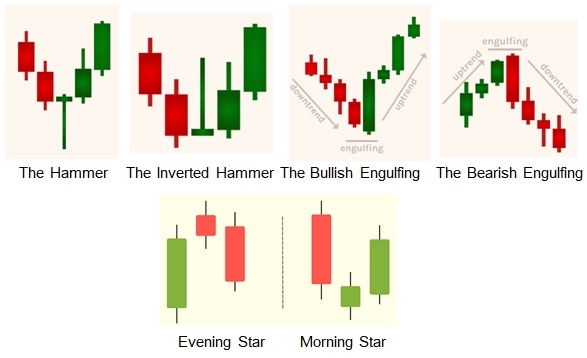
- Hammer: A Hammer is a candlestick with a small body and a long lower shadow. It shows that the price opened near the high, then dropped significantly, but recovered to close near the open. A Hammer can signal a bullish reversal after a downtrend, as it shows that the buyers have pushed the price back up.
- Engulfing: An Engulfing is a two-candlestick pattern, where the second candle completely covers the first one. There are two types of Engulfing patterns: bullish and bearish. A bullish Engulfing occurs when a small bearish candle is followed by a large bullish candle, indicating a potential bullish reversal. A bearish Engulfing occurs when a small bullish candle is followed by a large bearish candle, indicating a potential bearish reversal. Engulfing patterns often occur at key support and resistance levels.
- Morning Star: A Morning Star is a three-candlestick pattern that occurs at the end of a downtrend. It consists of a large bearish candle, followed by a small candle that gaps below the first one, and then a large bullish candle that gaps above the second one and closes above the midpoint of the first one. A Morning Star can signal a bullish reversal, as it shows that the sellers are losing momentum and the buyers are taking over.
- Evening Star: An Evening Star is the opposite of a Morning Star. It is a three-candlestick pattern that occurs at the end of an uptrend. It consists of a large bullish candle, followed by a small candle that gaps above the first one, and then a large bearish candle that gaps below the second one and closes below the midpoint of the first one. An Evening Star can signal a bearish reversal, as it shows that the buyers are losing momentum and the sellers are taking over.
Conclusion
Crypto candlestick charts are a powerful tool that can help you understand the price movements of different crypto assets over time. By learning how to read them, you can gain valuable insights into the trend, patterns, signals, strength, and volatility of the market, and use them to make better trading and investing decisions. However, keep in mind that crypto candlestick charts are not a magic bullet, and that you should always use them in combination with other tools and methods, such as fundamental analysis, risk management, and diversification. Happy trading!
Stay tuned to CoinCarp Social Media and Discuss with Us:
- Paybis Crypto Platform Overview Principiante 4m
- Bitcoin Is the Backup System: Scott Stornetta on Decentralization, Immutability, and Blockchain's Invisible Future Principiante 4m
- Mezo Launchpool on Bitget Opens With 4 Million MEZO Token Rewards for Participants Principiante 3m
- Can Aster Get Back To $1? Principiante 4m